云原生时代下链路追踪的最终形态:OpenTelemetry
本文部分内容参考 https://opentelemetry.io/
基本概念 分布式链路追踪 分布式链路追踪(Distributed Traces) ,更常见的说法是链路追踪(Trace) ,用于记录由应用程序或最终用户提出的请求在多服务架构(如微服务或 serverless 应用程序)中所传播的路径。
如果没有链路追踪,要想找出分布式系统中性能问题的原因是很困难的。
链路追踪提高了我们的应用或系统健康状况的可见性,让我们能够调试难以在本地重现的行为。链路追踪对于分布式系统来说是必不可少的,因为这些系统通常有非确定性的问题,或者过于复杂而无法在本地重现。
链路追踪使调试和理解分布式系统变得不那么困难,因为它分解了一个请求在分布式系统中流动时发生的情况。
一个链路追踪是由一个或多个 Span 组成的。第一个 Span 代表根 Span。每个根 Span 代表一个请求从开始到结束。父级 Span 下面的 Span 提供了一个更深入的背景,即在一个请求中发生了什么(或者说哪些步骤构成了一个请求)。
许多提供链路观测的后端将一个 Traces 可视化为瀑布图,看起来可能是这样的。
瀑布图显示了根 Span 和其子 Span 之间的父子关系。当一个 Span 封装了另一个 Span,这也代表了一种嵌套关系。
Span 一个 Span 代表一个工作单位或操作单位。它跟踪一个请求所做的具体操作,描绘出在执行该操作的时间内所发生的事情。
Span 包含名称、与时间相关的数据、结构化的日志信息和其他元数据(如属性,Attributes),以提供关于它所追踪的操作的信息。
下面是一个 Span 中的信息类型的例子。
Key
Value
net.transport
IP.TCP
net.peer.ip
10.244.0.1
net.peer.port
10243
net.host.name
localhost
http.method
GET
http.target
/cart
http.server_name
frontend
http.route
/cart
http.scheme
http
http.host
localhost
http.flavor
1.1
http.status_code
200
http.user_agent
Mozilla/5.0 (Macintosh; Intel Mac OS X 10_15_7) AppleWebKit/537.36 (KHTML, like Gecko) Chrome/106.0.0.0 Safari/537.36
背景 链路追踪为什么重要 微服务架构使开发者能够更快、更独立地构建和发布软件,因为他们不再受制于与单体架构相关的复杂的发布流程。
随着这些分布式系统的扩展,开发人员越来越难看到自己的服务是如何依赖或影响其他服务的,特别是在部署后或停运期间,速度和准确性至关重要。
并且,链路追踪带来的可观察性使开发者和运营商二者都能进一步明确系统的状态。
链路追踪的各种实践 为了使一个系统可以被观察到,它必须被插桩(instrumented) 。也就是说,代码必须发出跟踪、度量和日志,这些数据也被称为遥测数据 。然后,这些数据必须被发送到观测者(Observability) 后端。现在有很多观测者后端,从一些开源工具(如 Jaeger 和 Zipkin)到商业 SaaS 产品。
过去,对代码进行检测的方式会有所不同,因为每个观测者后端都有自己的检测库和代理,用于向工具发送数据。
这意味着向观测者后端发送数据时没有标准化的数据格式。此外,如果一个公司选择更换观测者后端,就意味着他们必须重新对其代码进行测量,并配置新的代理,以便能够向所选择的新工具发射遥测数据。
由于缺乏标准化,最终的结果是缺乏数据的可移植性,并给用户带来了维护插桩库的负担。
认识到标准化的需要,云计算社区走到一起,两个开源项目诞生了。OpenTracing(云原生计算基金会(CNCF)项目)和 OpenCensus(谷歌开源社区项目)。
OpenTelemetry 的诞生 为了拥有一个单一的标准,OpenCensus 和 OpenTracing 在 2019 年 5 月被合并为 OpenTelemetry(简称 OTel)。作为一个 CNCF 的孵化项目,OpenTelemetry 吸取了两个项目的精华,并去其糟粕。
OTel 的目标是提供一套标准化的、厂商无关的 SDK、API 和工具,用于提取、转换和发送数据到观测者后端。
OpenTelemetry 能做什么
每种编程语言都有一个单一的、与供应商无关的插桩库,支持自动和手动插桩。
提供一个单一的供应商中立的采集器二进制文件,可以以各种方式部署。
一个端到端的实现,以生成、发送、收集、处理和导出遥测数据。
完全控制你的数据,能够通过配置将数据并行地发送到多个目的地。
开放标准的语义约定,以确保供应商的数据收集不受影响
能够平行地支持多种上下文传播格式,以确保随着标准的发展,程序代码能够顺利迁移。
无论你在链路中处于什么位置,都能保证你的下游链路对你可见。
由于支持各种开源和商业协议、格式和上下文传播机制,以及为 OpenTracing 和 OpenCensus 项目提供兼容,在项目中采用 OpenTelemetry 是很容易的。
不过,与 Jaeger 、 Zipkin 等不同。OpenTelemetry 并不提供观测后端,它更类似于一种统一的 API ,用于给不同的观测后端提供数据。
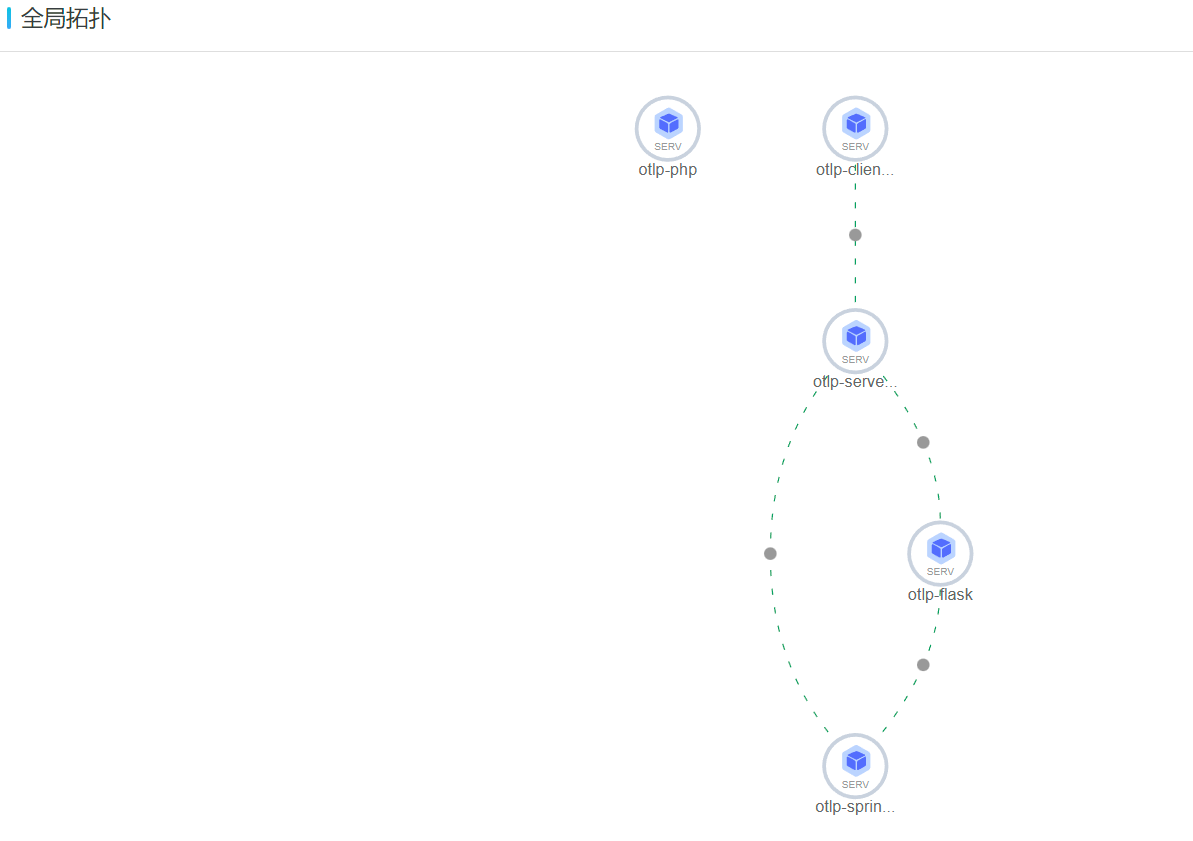
实践 目的 以阿里云作为观测者(Observability)后端,OpenTelemetry 为遥测接口。实现一个如下图所示的链路追踪:
拓扑图
节点列表
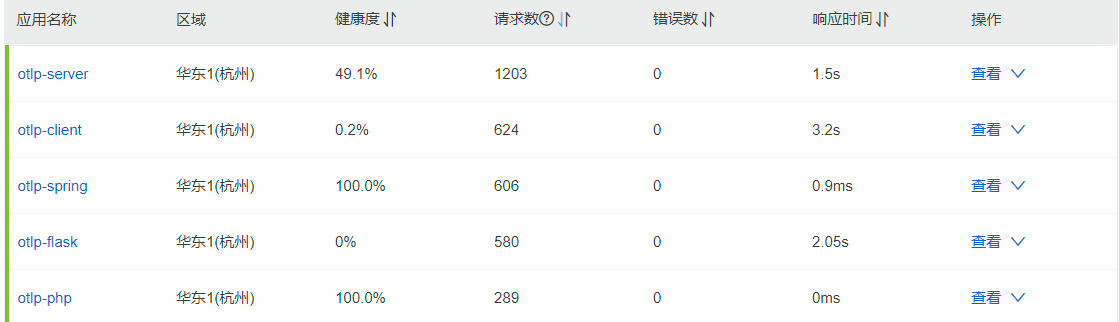
Node Name
Language
Instrumentation
otlp-server
Golang
Manual
otlp-client
Golang
Manual
otlp-flask
Python
Auto
otlp-spring
Java
Auto
otlp-php
PHP
Auto(not complete)
作为链路追踪的部署者(即运维角度),一个链路追踪在企业部署最大的阻力实际上在于其相关代码是否具有侵入性(即实现链路追踪是否需要大幅度更改生产环境源代码),通俗点讲就是开发给不给运维面子,因为本质上链路追踪是一种“苦开发、乐运维”的技术。除非在特细插桩粒度且由 运维开发 进行部署这种特殊情况,否则基本都应考虑自动插桩功能。
然而,截至至本文撰写时(2023.1.29),Golang 的自动插桩功能还未实现,而 PHP 的自动插桩功能存在很大问题,使用起来基本上和手动无异。因此在此特别说明,下文还将具体讨论。
实际上 Golang 和 C++ 的 OpenTelemetry 手动插桩功能已经非常完善了,但是仍然迟迟没有推出自动插桩插件。参考 OpenTelemetry 的 Java 自动插桩是基于 JVM 代理的字节码注入、Python 自动插桩是基于其解释性语言特性,我有理由怀疑在处理这两个语言的编译器上 OpenTelemetry 团队正遇到了不小困难。此处欢迎指正
Client 节点 Client 节点是一个利用 Go 编写的节点,只具有发送 HTTP 请求的功能。它是链路的起点。该节点源代码参考了 OpenTelemetry 的官方示例
该代码向 Server 节点的 7080 端口的 /hello 路由以一定时间间隔 发送 HTTP Get 请求。
由于 Golang 的原因,此处采用手动插桩的方式,因此代码量较大,且配置步骤较多。不过可以看出插桩的自定义范围也很广。
1 2 3 4 5 6 7 8 9 10 11 12 13 14 15 16 17 18 19 20 21 22 23 24 25 26 27 28 29 30 31 32 33 34 35 36 37 38 39 40 41 42 43 44 45 46 47 48 49 50 51 52 53 54 55 56 57 58 59 60 61 62 63 64 65 66 67 68 69 70 71 72 73 74 75 76 77 78 79 80 81 82 83 84 85 86 87 88 89 90 91 92 93 94 95 96 97 98 99 100 101 102 103 104 105 106 107 108 109 110 111 112 113 114 115 116 117 118 119 120 121 122 123 124 125 126 127 128 129 130 131 132 133 134 135 136 137 138 139 140 141 142 143 144 145 146 147 148 149 150 151 152 153 154 package mainimport ( "context" "go.opentelemetry.io/otel/exporters/otlp/otlptrace/otlptracegrpc" "google.golang.org/grpc" "log" "net/http" "os" "time" "go.opentelemetry.io/contrib/instrumentation/net/http/otelhttp" "go.opentelemetry.io/otel" "go.opentelemetry.io/otel/baggage" "go.opentelemetry.io/otel/exporters/otlp/otlptrace" "go.opentelemetry.io/otel/propagation" "go.opentelemetry.io/otel/sdk/resource" sdkTrace "go.opentelemetry.io/otel/sdk/trace" semConv "go.opentelemetry.io/otel/semconv/v1.4.0" ) const ClientServiceName = "otlp-demo-client" const TraceInstrumentationName = "otlp-demo-tracer" const DefaultServerEndpoint = "http://0.0.0.0:7080/hello" const otelAgentAddr, xtraceToken = "tracing-analysis-dc-hz.aliyuncs.com:8090" , "<你的阿里云 grpc token>" func initProvider () func () ctx := context.Background() headers := map [string ]string {"Authentication" : xtraceToken} traceClient := otlptracegrpc.NewClient( otlptracegrpc.WithInsecure(), otlptracegrpc.WithEndpoint(otelAgentAddr), otlptracegrpc.WithHeaders(headers), otlptracegrpc.WithDialOption(grpc.WithBlock())) traceExp, err := otlptrace.New(ctx, traceClient) handleErr(err, "Failed to create the collector trace exporter" ) res, err := resource.New(ctx, resource.WithFromEnv(), resource.WithProcess(), resource.WithTelemetrySDK(), resource.WithHost(), resource.WithAttributes( semConv.ServiceNameKey.String(ClientServiceName), ), ) handleErr(err, "failed to create resource" ) bsp := sdkTrace.NewBatchSpanProcessor(traceExp) tracerProvider := sdkTrace.NewTracerProvider( sdkTrace.WithSampler(sdkTrace.AlwaysSample()), sdkTrace.WithResource(res), sdkTrace.WithSpanProcessor(bsp), ) otel.SetTextMapPropagator(propagation.TraceContext{}) otel.SetTracerProvider(tracerProvider) log.Println("OTEL init success" ) return func () cxt, cancel := context.WithTimeout(ctx, time.Second) defer cancel() if err := traceExp.Shutdown(cxt); err != nil { otel.Handle(err) } } } func handleErr (err error , message string ) if err != nil { log.Fatalf("%s: %v" , message, err) } } func main () log.Printf("client start" ) shutdown := initProvider() defer shutdown() tracer := otel.Tracer(TraceInstrumentationName) method, _ := baggage.NewMember("method" , "repl" ) client, _ := baggage.NewMember("client" , "cli" ) bag, _ := baggage.New(method, client) defaultCtx := baggage.ContextWithBaggage(context.Background(), bag) for { ctx, span := tracer.Start(defaultCtx, "ExecuteRequest" ) makeRequest(ctx) span.End() time.Sleep(time.Duration(1 ) * time.Second) } } func makeRequest (ctx context.Context) demoServerAddr, ok := os.LookupEnv("DEMO_SERVER_ENDPOINT" ) if !ok { demoServerAddr = DefaultServerEndpoint } client := http.Client{ Transport: otelhttp.NewTransport(http.DefaultTransport), } req, err := http.NewRequestWithContext(ctx, "GET" , demoServerAddr, nil ) if err != nil { handleErr(err, "failed to http request" ) } res, err := client.Do(req) if err != nil { log.Println(err) } else { err := res.Body.Close() if err != nil { return } } }
Server 节点 Server 节点也是一个利用 Go 编写的节点,同时具有发送和接收 HTTP 请求的功能。它是链路的关键中继点。该节点源代码同样参考了 OpenTelemetry 的官方示例
该代码持续监听 7080 端口,同时向 Flask 节点( http://localhost:5000/test )、PHP 节点( http://localhost:8083/ )和 Spring 节点( http://localhost:5638/test )发送请求。请求以一定间隔发送。
与 Client 节点类似,此处采用手动插桩的方式。
1 2 3 4 5 6 7 8 9 10 11 12 13 14 15 16 17 18 19 20 21 22 23 24 25 26 27 28 29 30 31 32 33 34 35 36 37 38 39 40 41 42 43 44 45 46 47 48 49 50 51 52 53 54 55 56 57 58 59 60 61 62 63 64 65 66 67 68 69 70 71 72 73 74 75 76 77 78 79 80 81 82 83 84 85 86 87 88 89 90 91 92 93 94 95 96 97 98 99 100 101 102 103 104 105 106 107 108 109 110 111 112 113 114 115 116 117 118 119 120 121 122 123 124 125 126 127 128 129 130 131 132 133 134 135 136 137 138 139 140 141 142 143 144 145 146 147 148 149 150 151 152 153 154 155 156 157 158 159 160 161 162 163 164 165 166 167 168 169 170 171 172 173 174 175 176 177 178 179 180 181 182 183 184 185 186 187 188 189 190 191 192 193 194 195 196 197 198 199 200 201 202 203 204 205 206 207 208 209 210 211 212 213 214 215 216 217 218 219 220 221 222 223 224 225 226 227 228 229 230 231 232 233 234 235 236 237 238 239 240 241 242 243 244 245 246 247 248 249 250 251 252 253 254 255 256 257 258 259 260 261 262 263 264 265 266 267 268 269 270 271 272 273 274 275 276 277 278 279 280 281 282 283 284 285 286 287 288 289 290 291 292 293 294 295 296 297 298 299 300 301 302 303 304 305 package mainimport ( "context" "fmt" "go.opentelemetry.io/otel/codes" "go.opentelemetry.io/otel/exporters/otlp/otlptrace" "go.opentelemetry.io/otel/exporters/otlp/otlptrace/otlptracegrpc" "google.golang.org/grpc" "log" "math/rand" "net/http" "strconv" "time" "go.opentelemetry.io/contrib/instrumentation/net/http/otelhttp" "go.opentelemetry.io/otel" "go.opentelemetry.io/otel/attribute" "go.opentelemetry.io/otel/propagation" "go.opentelemetry.io/otel/sdk/resource" sdktrace "go.opentelemetry.io/otel/sdk/trace" semconv "go.opentelemetry.io/otel/semconv/v1.4.0" "go.opentelemetry.io/otel/trace" ) var rng = rand.New(rand.NewSource(time.Now().UnixNano()))const SpanNameVariety = 1000 const AttrValueVariety = 10000 const AttrMaxLen = 10000 const AttrMinLen = 1000 const SpanNameMaxLen = 64 const SpanNameMinLen = 32 const ServerServiceName = "otlp-server" const TraceInstrumentationName = "otlp-demo-tracer" const otelAgentAddr = "tracing-analysis-dc-hz.aliyuncs.com:8090" const xtraceToken = "<你的阿里云 grpc token>" var avaAttrValue = [AttrValueVariety]string {}var avaSpanName = [SpanNameVariety]string {}func initProvider () func () ctx := context.Background() headers := map [string ]string {"Authentication" : xtraceToken} traceClient := otlptracegrpc.NewClient( otlptracegrpc.WithInsecure(), otlptracegrpc.WithEndpoint(otelAgentAddr), otlptracegrpc.WithHeaders(headers), otlptracegrpc.WithDialOption(grpc.WithBlock())) log.Println("start to connect to server" ) traceExp, err := otlptrace.New(ctx, traceClient) handleErr(err, "Failed to create the collector trace exporter" ) log.Println("trace new finish" ) res, err := resource.New(ctx, resource.WithFromEnv(), resource.WithProcess(), resource.WithTelemetrySDK(), resource.WithHost(), resource.WithAttributes( semconv.ServiceNameKey.String(ServerServiceName), ), ) handleErr(err, "failed to create resource" ) log.Println("resource new finish" ) bsp := sdktrace.NewBatchSpanProcessor(traceExp) tracerProvider := sdktrace.NewTracerProvider( sdktrace.WithSampler(sdktrace.AlwaysSample()), sdktrace.WithResource(res), sdktrace.WithSpanProcessor(bsp), ) otel.SetTextMapPropagator(propagation.TraceContext{}) otel.SetTracerProvider(tracerProvider) return func () cxt, cancel := context.WithTimeout(ctx, time.Second) defer cancel() if err := traceExp.Shutdown(cxt); err != nil { otel.Handle(err) } } } func handleErr (err error , message string ) if err != nil { log.Fatalf("%s: %v" , message, err) } } func initTraceDemoData () for i := 0 ; i < len (avaAttrValue); i++ { avaAttrValue[i] = "AttrValue " + strconv.Itoa(i) } for i := 0 ; i < len (avaSpanName); i++ { avaSpanName[i] = "SpanName " + strconv.Itoa(i) } } func main () shutdown := initProvider() defer shutdown() serverAttribute := attribute.String("server-attribute" , "foo" ) fmt.Println("start to gen chars for trace data" ) initTraceDemoData() fmt.Println("gen trace data done" ) tracer := otel.Tracer(TraceInstrumentationName) handler := http.HandlerFunc(func (w http.ResponseWriter, req *http.Request) var sleep int64 switch modulus := time.Now().Unix() % 5 ; modulus { case 0 : sleep = rng.Int63n(2000 ) case 1 : sleep = rng.Int63n(15 ) case 2 : sleep = rng.Int63n(917 ) case 3 : sleep = rng.Int63n(87 ) case 4 : sleep = rng.Int63n(1173 ) } ctx := req.Context() span := trace.SpanFromContext(ctx) span.SetAttributes(serverAttribute) actionChild(tracer, ctx, sleep) connectFlask(tracer, ctx) connectPhp(tracer, ctx) connectSpring(tracer, ctx) _, err := w.Write([]byte ("Hello World" )) if err != nil { fmt.Println(err) return } }) wrappedHandler := otelhttp.NewHandler(handler, "/hello" ) http.Handle("/hello" , wrappedHandler) err := http.ListenAndServe(":7080" , nil ) if err != nil { fmt.Println(err) return } } func actionChild (tracer trace.Tracer, ctx context.Context, sleep int64 ) _, subSpan := tracer.Start(ctx, "back-end subSpan" ) defer subSpan.End() time.Sleep(time.Duration(sleep) * time.Millisecond) errTest := fmt.Errorf("测试:span 发生错误" ) subSpan.RecordError(errTest) subSpan.SetStatus(codes.Error, errTest.Error()) serverAttribute := attribute.String("attr1" , "attr for test" ) subSpan.SetAttributes(serverAttribute) } func connectSpring (tracer trace.Tracer, ctx context.Context) _, subSpan := tracer.Start(ctx, "backend-connect-spring" ) defer subSpan.End() client := http.Client{ Transport: otelhttp.NewTransport(http.DefaultTransport), } req, err := http.NewRequestWithContext(ctx, "GET" , "http://localhost:5638/test" , nil ) if err != nil { handleErr(err, "failed to http request" ) } res, err := client.Do(req) if err != nil { log.Println(err) } else { err := res.Body.Close() if err != nil { return } } subSpan.SetStatus(codes.Ok, "success" ) serverAttribute := attribute.String("attr_test" , "Go_to_Java" ) subSpan.SetAttributes(serverAttribute) } func connectPhp (tracer trace.Tracer, ctx context.Context) _, subSpan := tracer.Start(ctx, "backend-connect-php" ) defer subSpan.End() client := http.Client{ Transport: otelhttp.NewTransport(http.DefaultTransport), } req, err := http.NewRequestWithContext(ctx, "GET" , "http://localhost:8083/" , nil ) if err != nil { handleErr(err, "failed to http request" ) } res, err := client.Do(req) if err != nil { log.Println(err) } else { err := res.Body.Close() if err != nil { return } } subSpan.SetStatus(codes.Ok, "success" ) serverAttribute := attribute.String("attr_test" , "Go_to_Php" ) subSpan.SetAttributes(serverAttribute) } func connectFlask (tracer trace.Tracer, ctx context.Context) _, subSpan := tracer.Start(ctx, "backend-connect-flask" ) defer subSpan.End() client := http.Client{ Transport: otelhttp.NewTransport(http.DefaultTransport), } req, err := http.NewRequestWithContext(ctx, "GET" , "http://localhost:5000/test" , nil ) if err != nil { handleErr(err, "failed to http request" ) } res, err := client.Do(req) if err != nil { log.Println(err) } else { err := res.Body.Close() if err != nil { return } } subSpan.SetStatus(codes.Ok, "success" ) serverAttribute := attribute.String("attr_test" , "Go_to_Python" ) subSpan.SetAttributes(serverAttribute) }
Flask 节点 采用 Python Flask Web 框架编写的节点。该节点监听 5000 端口,并同样请求 Spring 节点的 5638 端口。由于采用了无侵入的插桩方式,其代码与原业务代码几乎没有任何区别。
1
2
3
4
5
6
7
8
9
10
11
12
13
14
15
16
17
18
19
20
21
import requestsfrom flask import Flaskapp = Flask(__name__) @app.route('/' @app.route('/test' def hello_world (): try : r = requests.get('http://localhost:5638/test' ) return 'Hello World, this is Python Flask server ! The information {0} is from Java Spring server.' .format ( r.text) except requests.exceptions.InvalidSchema as e: return 'Hello World, this is Python Flask server !' if __name__ == '__main__' : app.run(host='0.0.0.0' , port=5000 )
根据官方文档 ,通过 pip 下载 OpenTelemetry 的 Python 代理。然后,按照如下指令运行( Windows PowerShell 环境) Flask 项目:
1
2
3
4
5
6
7
8
9
10
11
12
13
14
$ h_name = hostname # 上面一条指令用于告诉阿里云该 Python 程序运行的设备主机名/IP # 这条指令需要单独运行 opentelemetry-instrument ` --traces_exporter otlp_proto_grpc ` --metrics_exporter none ` --resource_attributes host.name=$h_name ` --service_name otlp-flask ` --exporter_otlp_endpoint http://tracing-analysis-dc-hz.aliyuncs.com:8090 ` --exporter_otlp_headers "<你的阿里云 grpc token>" ` --exporter_otlp_insecure true ` python app_pure.py
Spring 节点 采用 Java Spring Boot 框架编写的节点。该节点监听 5638 端口。由于采用了无侵入的插桩方式,其代码就是一个完整的 Spring 项目,无需添加任何额外的 Maven 依赖 。
其基本依赖如下:
1 2 3 4 5 6 7 8 <dependency > <groupId > org.springframework.boot</groupId > <artifactId > spring-boot-starter-web</artifactId > </dependency > <dependency > <groupId > org.springframework.boot</groupId > <artifactId > spring-boot-starter-web-services</artifactId > </dependency >
Controller 编写如下:
1
2
3
4
5
6
7
8
9
10
11
12
13
14
15
16
17
18
19
20
21
22
package com.jzyx.otlp.controller;import jakarta.servlet.http.HttpServletResponse;import org.springframework.web.bind.annotation.RequestMapping;import org.springframework.web.bind.annotation.RestController;import java.io.IOException;@RestController @RequestMapping("/") public class OtlpController { @RequestMapping("/") public void index (HttpServletResponse response) throws IOException { response.sendRedirect("/test" ); } @RequestMapping("/test") public String test () { return "Java Spring Return OK!" ; } }
application.properties 如下:
1
2
spring.application.name =Java-Spring-Server server.port =5638
然后,通过 Maven 将其构建为一个 jar 包 otlp-0.0.1-SNAPSHOT.jar ,再从官方文档 下载 OpenTelemetry 的 Java 代理 opentelemetry-javaagent.jar 。二者放在同一目录后(建议在 Linux 环境中,Windows 环境我测试后容易出问题),执行以下命令运行项目:
1
2
3
4
5
6
7
java -javaagent:opentelemetry-javaagent.jar \ -Dotel.service.name=otlp-spring \ -Dotel.traces.exporter=otlp \ -Dotel.metrics.exporter=none \ -Dotel.exporter.otlp.headers=Authentication=<你的阿里云 grpc token> \ -Dotel.exporter.otlp.endpoint=http://tracing-analysis-dc-hz.aliyuncs.com:8090 \ -jar otlp-0.0.1-SNAPSHOT.jar
PHP 节点 在官方文档 中,PHP 语言是支持自动插桩的。然而,在本文使用(2023.1)时,PHP 的自动插桩插件实际上版本只迭代到第三版,存在诸多不足,甚至在可用性方面都存在问题。官方文档 或 Github 仓库 中的示例代码也很让人困惑,以我入门级别的 PHP 水平,并不能依据这些例子编写出没有侵入性的插桩代码——这已经稍微可以说明这个自动插桩功能对非开发的运维人员来说是较为失败的了。
在安装 PHP 的 OpenTelemetry 自动插桩插件后,我只能把 PHP 源代码修改为类似手动插桩的样子才能令 PHP 的遥测信息能够被阿里云监测。即便如此,还是存在着阿里云无法在整条链路中监测出 PHP 节点的情况,导致 PHP 节点在链路拓扑中呈现被“孤立”的情况 。
如果有相关经验的朋友可以告知我要如何解决上述这些问题。接下来我讲继续介绍这个并不完美的“自动”插桩 PHP 节点的具体实践。
以下操作都在 Linux 环境(WSL)中执行
由于插件需要 PHP 8.0+ 环境,且安装过程较为繁琐。因此使用 PHP 官方镜像安装自动插桩插件并生成 PHP 容器,Dockerfile 如下:
1
2
3
4
5
6
7
FROM php:8.2 .1 -fpmRUN curl -sSLf \ -o /usr/local/bin/install-php-extensions \ https://github.com/mlocati/docker-php-extension-installer/releases/latest/download/install-php-extensions && \ chmod +x /usr/local/bin/install-php-extensions && \ install-php-extensions open-telemetry/opentelemetry-php-instrumentation@main
在该 Dockerfile 目录下,直接运行:
1 sudo docker build -t php-otel .
这样就生成了带有 OpenTelemetry 自动插桩插件的 php 8.2.1-fpm 镜像。
在进行下一步之前,先在本地创建卷映射目录,以我创建的为例:
/home/lgh/php/nginx/www/: 存放一个 index.php 文件,还可以在该目录本地直接运行 pickle 、 composer 等工具来配置 php 插件或包,无需进入容器再安装/home/lgh/php/nginx/conf/conf.d/: 存放一个 otel-test-php.conf 文件,即 nginx 配置文件,内容如下:
1
2
3
4
5
6
7
8
9
10
11
12
13
14
15
16
17
18
19
20
21
server { listen 80; server_name localhost; location / { root /usr/share/nginx/html; index index.html index.htm index.php; } error_page 500 502 503 504 /50x.html; location = /50x.html { root /usr/share/nginx/html; } location ~ \.php$ { fastcgi_pass php:9000; fastcgi_index index.php; fastcgi_param SCRIPT_FILENAME /var/www/html/$fastcgi_script_name; include fastcgi_params; } }
fastcgi 是针对 fpm 镜像使用的
然后,需要使用以下指令生成一个配置好的 php 容器 otel_php :
1
2
3
4
5
6
7
8
9
10
11
12
sudo docker run -d --name=otel_php \ -v /home/lgh/php/nginx/www:/var/www/html \ -e OTEL_PHP_AUTOLOAD_ENABLED=true \ -e OTEL_SERVICE_NAME=otlp-php \ -e OTEL_TRACES_EXPORTER=otlp \ -e OTEL_EXPORTER_OTLP_PROTOCOL=grpc \ -e OTEL_METRICS_EXPORTER=none \ -e OTEL_LOGS_EXPORTER=none \ -e OTEL_EXPORTER_OTLP_ENDPOINT="http://tracing-analysis-dc-hz.aliyuncs.com:8090" \ -e OTEL_EXPORTER_OTLP_INSECURE=true \ -e OTEL_EXPORTER_OTLP_HEADERS="<你的阿里云 grpc token>" \ php-otel
可以用 /bin/sh 进入该容器输入 php -m | grep otel_instrumentation 验证插件是否安装完毕
然后,我们需要通过 nginx 来使得 php 能被解析,特别是对 fpm 的 php 镜像。因此还需要一个额外的 nginx 容器 otel-php-nginx :
1
2
3
4
5
sudo docker run --name otel-php-nginx -p 8083:80 -d \ -v /home/lgh/php/nginx/www:/usr/share/nginx/html:ro \ -v /home/lgh/php/nginx/conf/conf.d:/etc/nginx/conf.d:ro \ --link otel_php:php \ nginx
接下来,在 /home/lgh/php/nginx/www/index.php 中输入 php 代码,在浏览器的 http://localhost:8083/ 就能看出结果。但我尝试很多次,确认插件正常安装,官方的自动插桩代码仍然无法运行,因此我不得不使用 composer 在该目录下安装手动插桩 的依赖,最后获得的 php 代码是这样的:
1
2
3
4
5
6
7
8
9
10
11
12
13
14
15
16
17
18
19
20
21
22
23
24
25
26
27
28
29
30
31
32
33
34
35
36
37
38
39
40
41
42
43
44
45
46
47
48
49
50
51
52
53
54
55
56
57
58
59
60
61
62
63
64
65
66
67
68
69
70
71
72
73
<?php declare (strict_types=1 );require __DIR__ . '/vendor/autoload.php' ;use OpenTelemetry \Contrib \Otlp \OtlpHttpTransportFactory ;use OpenTelemetry \Contrib \Otlp \SpanExporter ;use OpenTelemetry \SDK \Common \Attribute \Attributes ;use OpenTelemetry \SDK \Common \Time \ClockFactory ;use OpenTelemetry \SDK \Trace \SpanProcessor \BatchSpanProcessor ;use OpenTelemetry \SDK \Trace \TracerProvider ;use OpenTelemetry \SDK \Resource \ResourceInfo ;use OpenTelemetry \SDK \Resource \ResourceInfoFactory ;use OpenTelemetry \SDK \Trace \Span ;use OpenTelemetry \API \Trace \StatusCode ;use OpenTelemetry \Context \Context ;$transport = (new OtlpHttpTransportFactory ())->create ('<你的阿里云 HTTP 接入点>' , 'application/json' );$exporter = new SpanExporter ($transport );$resource = ResourceInfoFactory ::merge (ResourceInfo ::create (Attributes ::create (['service.name' => 'otlp-php' , 'host.name' => gethostname ()])), ResourceInfoFactory ::defaultResource ());echo 'Starting OTLP+json example' ;$tracerProvider = new TracerProvider ( new BatchSpanProcessor ( $exporter , ClockFactory ::getDefault () ), null , $resource , ); $tracer = $tracerProvider ->getTracer ('otlp-demo-tracer' );OpenTelemetry\Instrumentation\hook ( DemoClass ::class , 'run' , static function (DemoClass $demo , array $params , string $class , string $function , ?string $filename , ?int $lineno ) use ($tracer ) { $tracer ->spanBuilder ($class ) ->startSpan () ->activate (); }, static function (DemoClass $demo , array $params , $returnValue , ?Throwable $exception ) use ($tracer $scope = Context ::storage ()->scope (); $scope ?->detach (); $span = Span ::fromContext ($scope ->context ()); $exception && $span ->recordException ($exception ); $span ->setStatus ($exception ? StatusCode ::STATUS_ERROR : StatusCode ::STATUS_OK ); $span ->end (); } ); class DemoClass public function run (void { echo "running" ; } } $demo_fun = new DemoClass ();$demo_fun ->run ();echo PHP_EOL . 'OTLP+json example complete! ' ;echo PHP_EOL;echo date ('Y-m-d H:i:s' );$tracerProvider ->shutdown ();
看起来实际上最后还是回到手动插桩了……而且效果还不好
结论 可以看出,在本次使用的各种语言中,OpenTelemetry 对 Python 和 Java 的支持最好;Go 的支持也不差,但改进空间也很大;PHP 的支持最不好,这可能和其社区较小有关。
然而,本次实践没有评估接入链路追踪对应用链路的性能影响,可能需要进一步更贴近生产规模的实验才能进一步说明。
同时,本次实践没有使用 OpenTelemetry 官方推荐的 OpenTelemetry Collector 方式,即独立部署一个 OpenTelemetry Collector 节点采集各个待观测节点的遥测信息,然后再上报给观测者后端(阿里云)。官方推荐 在任何生产情况下采用这种方式,这也是未来我可能对 OpenTelemetry 进一步调研的方向。
OpenTelemetry 可以说是链路追踪的未来,但它不能代表链路追踪的当下。如果急切需要稳定高可用的链路追踪方案,选择 Jaeger 与 Zipkin 等开源方案也未尝不可。
注意事项
节点时间不同步造成的 trace 高时延假象 ,一文中提到的现象同时也存在于本次实践中,在部署链路追踪或诊断链路时需要注意这方面的配置问题。实际上,阿里云提供了有关链路追踪相关的文档 ,但其内容相对较老,与 OpenTelemetry 官方文档相比,后者的参考价值更大一些。